- (727) 591-5300
- support@nearnetlocal.com
- 7904 Willow Brook CT, Hudson FL 34667
Most local service business owners are flying blind with their Google Business Profile analytics. They check the monthly report, see that views went up, maybe notice a few more calls, and call it good. But here’s the harsh reality: those basic metrics are barely scratching the surface of what your GBP data can reveal about your market position, customer behavior, and revenue opportunities.
While your competitors are celebrating vanity metrics like profile views, advanced operators are extracting actionable business intelligence that drives strategic decisions. They’re identifying untapped market segments, predicting seasonal demand fluctuations, and systematically outmaneuvering competition through data-driven optimization.
The difference between basic reporting and advanced performance tracking isn’t just about having more numbers—it’s about understanding the story your data tells about customer intent, market dynamics, and growth opportunities. This guide will transform you from a passive data consumer into a strategic analyst who uses GBP analytics to dominate your local market.
Beyond the surface-level metrics that most businesses fixate on lies a wealth of behavioral intelligence that reveals how customers actually interact with your business profile. Understanding these deeper indicators is the difference between knowing you got traffic and knowing why specific customers chose you over competitors.
Raw view counts tell you almost nothing about customer intent or business impact. The real intelligence comes from engagement ratios that reveal customer behavior patterns. Calculate your Action-to-View Ratio using this formula:
Actions include calls, direction requests, website clicks, and photo views. A declining ratio despite increasing views often indicates declining relevance or optimization issues. Track this weekly to identify performance trends before they impact revenue.
Monitor your Photo Engagement Rate to understand visual content performance:
Different customer actions reveal distinct stages of the buying journey. Website clicks typically indicate research-phase customers, while direct calls suggest high purchase intent. Track the distribution of customer actions to understand your market’s decision- making patterns.
Analyze your Call-to-Click Ratio to gauge customer urgency levels:
Direction requests combined with calls within 24 hours often indicate successful conversions. This pattern helps identify your most valuable traffic sources and optimal posting times for urgent service offers.
The search terms that trigger your GBP appearance reveal market demand patterns that most businesses completely ignore. Direct searches (your business name) indicate brand recognition, while discovery searches show category demand and competitive positioning.
Track your Brand Recognition Index:
Discovery searches reveal market opportunities and competitive threats. When “emergency plumber near me” searches spike in your area, that’s actionable intelligence for inventory planning, staffing adjustments, and promotional timing.
Visual content performance directly correlates with customer engagement and conversion rates. Track individual photo view counts to identify which types of content resonate most with your market. Before/after project photos typically generate 3-5x more engagement than generic service images.
Post performance metrics reveal content strategy effectiveness. Updates about completed projects often drive more calls than promotional posts. Track post views, clicks, and subsequent customer actions to optimize your content mix.
Review velocity (frequency of new reviews) impacts search ranking more than most businesses realize. Calculate your Review Acquisition Rate:
Monitor how review timing correlates with visibility spikes. Businesses often see 20- 30% increases in profile views within 48 hours of receiving quality reviews, especially when they include specific service keywords.
Isolated GBP analytics provide limited business intelligence. The real insights emerge when you integrate Google Business Profile data with comprehensive customer journey tracking, creating a complete picture of how local search drives revenue.
Set up UTM parameters for your GBP website link to track visitor behavior after they click through from your profile. Use this structure:
Configure Google Analytics 4 goals for key customer actions: contact form submissions, service area page views, and time spent on pricing pages. This reveals how GBP traffic converts compared to other sources and helps calculate true customer acquisition costs.
Create custom segments for GBP visitors to analyze their behavior patterns. GBP traffic often converts faster than general organic traffic because these visitors already have location-based intent. Track their conversion paths to optimize your website experience for local search visitors.
Implement dynamic number insertion (DNI) for GBP-driven website visitors to track complete customer journeys. This reveals which visitors called after browsing your website versus those who called directly from your profile.
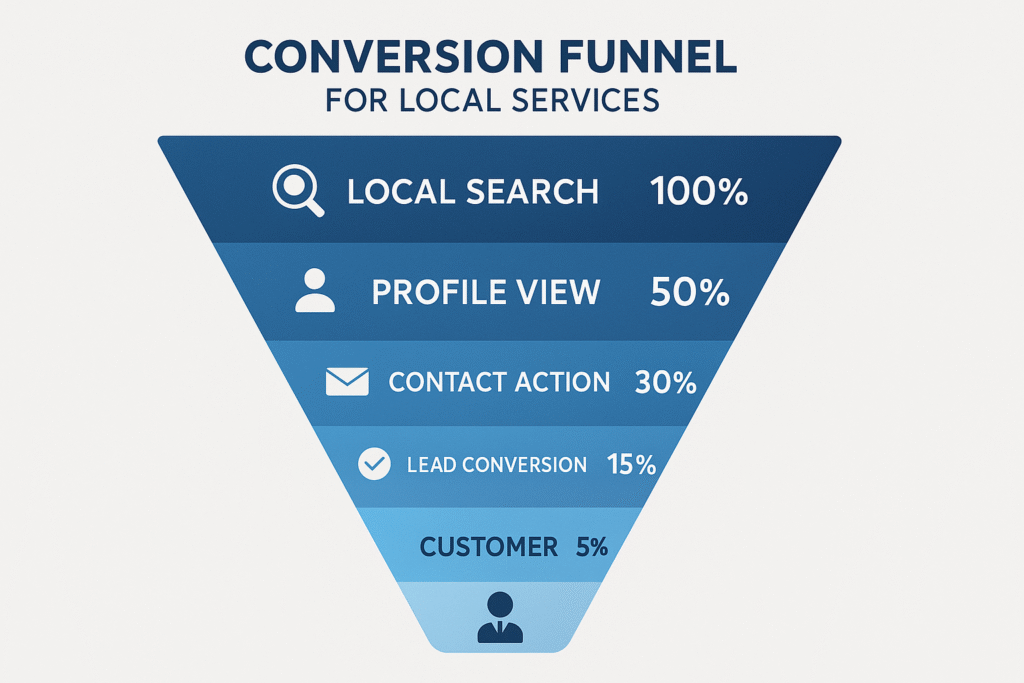
Use call tracking data to calculate your Total GBP Conversion Rate:
This comprehensive conversion tracking reveals the true impact of your GBP optimization efforts and helps justify marketing investments to skeptical business owners.
Build automated reporting dashboards that combine GBP data with revenue metrics. Use Google Data Studio or similar tools to create visualizations that show correlations between profile performance and business outcomes.
Include these key performance indicators in your dashboard:
For businesses with multiple locations, comparative analytics reveal performance disparities and growth opportunities. Calculate location performance indices to identify top and bottom performers:
Track performance variations by location to identify successful strategies that can be replicated across underperforming markets. Often, high-performing locations have specific content or posting strategies that drive superior results.
Your GBP analytics contain valuable intelligence about competitive positioning and market dynamics that most businesses never extract. Advanced operators use this data to identify market gaps, predict competitor strategies, and systematically capture market share.
While you can’t see competitors’ exact data, you can estimate market share through search impression analysis and customer action patterns. Track how your search appearance frequency changes relative to major competitors in your service area.
Monitor search query patterns to identify market segments where you’re gaining or losing ground. When “24 hour plumber” searches start converting better for your profile, that indicates successful positioning in the emergency services market.
Use publicly available competitor data to establish performance benchmarks. Review acquisition rates, posting frequency, and photo update patterns provide insights into competitor marketing strategies and customer engagement levels.
Create a competitive tracking spreadsheet that monitors:
Track how local search results change over time to identify algorithm updates, new competitors, and market dynamics. Screenshot search results monthly for key service terms to document visibility changes and competitive positioning shifts.
Monitor which businesses appear in the local pack for your primary keywords and track position changes over time. New competitors entering the top 3 positions often indicate market opportunities or threats that require strategic response.
Analyze search query data to identify service demands that competitors aren’t adequately addressing. When “eco-friendly pest control” searches increase but no local competitors emphasize environmental services, that’s a positioning opportunity.
Look for seasonal patterns in competitor activity. Many businesses reduce marketing efforts during slow seasons, creating opportunities for aggressive operators to capture increased market share when competition decreases.
Advanced analytics are worthless without systematic processes for turning data into strategic business decisions. The most successful local service businesses use their GBP data to predict market changes, optimize resource allocation, and systematically outperform competitors.
Transform raw analytics into strategic intelligence by connecting GBP performance patterns with revenue outcomes. When photo engagement rates decline, but call volume remains stable, that suggests customers are making faster decisions—possibly indicating increased urgency or improved trust signals.
Use customer action timing to optimize staffing and promotional strategies. If direction requests spike on Saturday mornings followed by calls within 2 hours, ensure adequate weekend staffing and prepare emergency service promotions for weekend posting.
Develop seasonal forecasting models using historical GBP data combined with external factors like weather patterns, economic indicators, and local events. This predictive intelligence enables proactive business planning rather than reactive scrambling.
Calculate your Seasonal Multiplier for different service categories:
Track leading indicators that predict demand spikes. HVAC businesses often see GBP search increases 7-10 days before major weather changes, providing advance notice for resource preparation.
Quantify the business impact of your GBP optimization investments to justify continued efforts and budget allocation. Track revenue attribution from GBP-driven customers and calculate lifetime value differences compared to other acquisition channels.
Include both direct costs (posting time, photo creation, review management) and indirect costs (website optimization, call handling) for accurate ROI calculation. Most businesses discover GBP optimization delivers 300-500% ROI when properly tracked.
Identify successful strategies from high-performing locations or service categories that can be systematically implemented across your entire business. If commercial clients convert 40% better than residential through GBP, that intelligence should drive content strategy adjustments.
Create optimization playbooks based on your analytics insights that can be replicated as you expand into new markets. Document which posting themes, photo types, and promotional strategies drive the best results for systematic implementation.
Advanced GBP analytics separate local market leaders from businesses that stumble through optimization hoping for results. The insights revealed through systematic performance tracking enable strategic decision-making that consistently outperforms competitors who rely on intuition and basic reporting.
The businesses dominating local search in 2025 won’t be those with the biggest marketing budgets—they’ll be the ones who extract maximum intelligence from their data and systematically optimize based on customer behavior patterns, market dynamics, and competitive positioning opportunities.
Your GBP profile generates dozens of data points daily that reveal customer intent, market trends, and competitive intelligence. The question is whether you’ll continue treating this data as interesting numbers or transform it into the strategic advantage that drives systematic business growth.

© 2025 Nearnet Digital Solutions LLC All Rights Reserved.
Terms of Service | Privacy Policy | Trusted Partners